FHI 360
Creating Interactive Maps with ArcGIS.com
Interactive maps have become a powerful tool for presenting data in a dynamic and engaging manner.
2015 · 46 pages
Sign in to readA free account is required to download.
Abstract
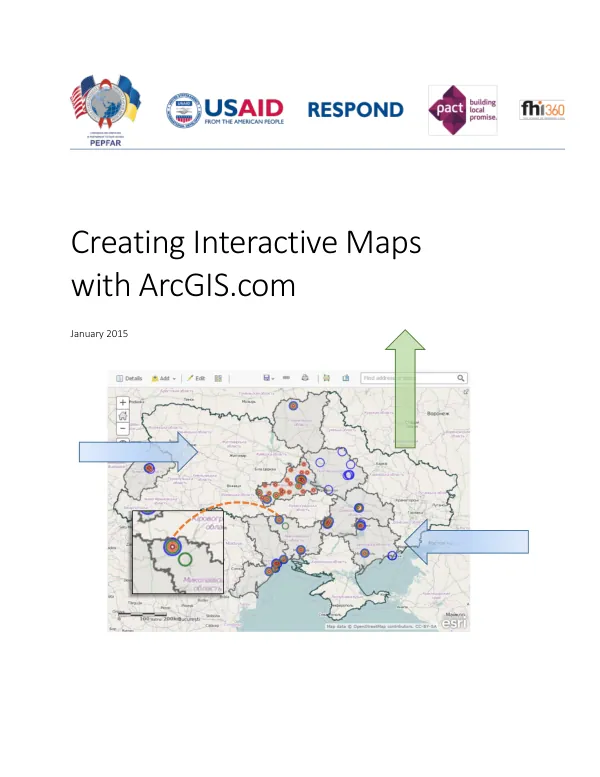
With the advancement of mapping technology, cartographers can now create maps that allow the audience to interact with the data, exploring it further and gaining a deeper understanding of the information presented. However, creating interactive maps requires careful consideration of the presentation of data, as the audience may be influenced by the choices made by the cartographer. The freely available version of the ArcGIS.com software provides a platform for creating interactive maps using one's own data. While the software can be cumbersome to use, with practice, anyone can create maps that showcase their interests. The manual describes the process of creating interactive maps using ArcGIS.com, covering topics such as cartographic design, data and databases, and creating interactive maps. Map ethics play a crucial role in the creation of interactive maps. Cartographers must be sensitive to various factors, including color choice, wording, data classification groupings, symbology, and content inclusion or exclusion. For instance, a map showing a community with specific areas listed as "high violent crime rates" and colored in bright red may influence the audience's perception of the community. Cartographers must consider the potential impact of their maps on the audience and strive to produce ethically appropriate maps. Protecting personal information is another critical aspect of map ethics. Displaying data on a map that allows the audience to determine an individual's information is ethically inappropriate. To protect personal information, cartographers can aggregate the data, such as displaying a total number of HIV positive individuals in a given district rather than showing individual household addresses. This approach ensures that the data is presented while maintaining the confidentiality of the individuals involved. Data misrepresentation is also a concern when creating interactive maps. Cartographers are responsible for ensuring that the map represents the data in the clearest and most appropriate way without changing the meaning of the data. This includes avoiding exaggeration and underrepresentation of data through color choice and other visual elements. For example, using a large range of colors to show small ranges in the data can mislead the audience into believing that the variability in the data is greater than it actually is. In terms of cartographic design, considerations for designing interactive maps include the function and limitations of design in ArcGIS.com. Cartographers must balance the need for clear and concise presentation of data with the need to engage the audience and encourage exploration of the data. This may involve using a range of visual elements, such as colors, symbols, and labels, to convey the information presented in the map. The ArcGIS.com software provides a range of tools and features for creating interactive maps, including the ability to add point data from a table to a map, add polygon data from a shapefile to a map, and symbolize features. Cartographers can also use the software to create pop-up windows, edit map data, and save layers and maps. By mastering these tools and techniques, cartographers can create interactive maps that effectively communicate their message and engage their audience. Ultimately, creating interactive maps requires a combination of technical skills, cartographic design expertise, and attention to map ethics. By following best practices and using the tools and features available in ArcGIS.com, cartographers can create maps that are both informative and engaging, providing a valuable resource for audiences around the world.