USAID DEC
POPGIS – An Application Service for Air Pollution Management and Analysis in Vietnam
Sign inUSAID DEC
POPGIS – An Application Service for Air Pollution Management and Analysis in Vietnam
Fine particulate matter (PM2.5) pollution is a significant problem in Vietnam, particularly in mega-cities such as Hanoi and Ho Chi Minh City.
2023 · 5 pages
Sign in to readA free account is required to download.
Abstract
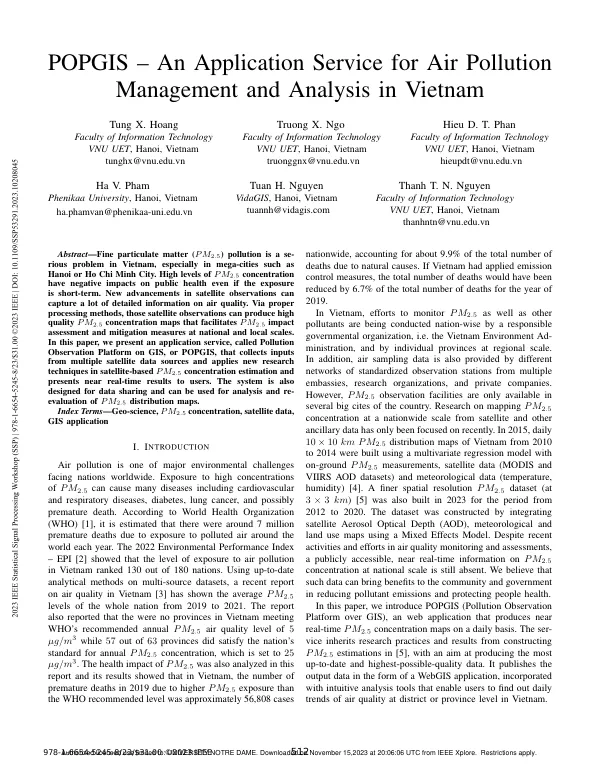
High levels of PM2.5 concentration have negative impacts on public health, even with short-term exposure. New advancements in satellite observations can capture detailed information on air quality, and proper processing methods can produce high-quality PM2.5 concentration maps that facilitate impact assessment and mitigation measures at national and local scales. The Vietnam Environment Administration and individual provinces conduct efforts to monitor PM2.5 and other pollutants nationwide. Air sampling data is also provided by different networks of standardized observation stations from multiple embassies, research organizations, and private companies. However, PM2.5 observation facilities are only available in several big cities of the country. Research on mapping PM2.5 concentration at a nationwide scale from satellite and other ancillary data has only been focused on recently. A publicly accessible, near real-time information on PM2.5 concentration at national scale is still absent. Such data can bring benefits to the community and government in reducing pollutant emissions and protecting people's health. To address this gap, a web application called POPGIS (Pollution Observation Platform over GIS) has been developed. POPGIS produces near real-time PM2.5 concentration maps on a daily basis, inheriting research practices and results from constructing PM2.5 estimations. The service publishes output data in the form of a WebGIS application, incorporated with intuitive analysis tools that enable users to find out daily trends of air quality at district or province level in Vietnam. Air quality measurement methods include using hardware sensors or dust samplers, which can measure various air quality factors, including PM2.5. However, this method is usually costly and requires strict operating conditions. More economic approaches for monitoring air quality at large scales work by estimating PM2.5 concentrations based on various data sources, including measurements from air observation stations, satellite imagery, and meteorological data. Spatial interpolation methods can be applied to estimate the distribution of PM2.5 in a region. For example, research has used Kriging to build PM2.5 concentration maps from data of 32 observation sites. Recent studies have proposed complex statistical models for estimating PM2.5 from satellite imagery, especially Moderate Resolution Imaging Spectroradiometer (MODIS) and Aerosol Optical Depth (AOD) data. Such methods have been widely used for regional PM2.5 concentration maps, and their reliability has been carefully studied. For instance, a study estimated daily ground-level PM2.5 concentrations in the southeastern US using Geographically Weighted Regression (GWR), reporting results of 10-fold cross validation with a coefficient of determination R2 at 0.71 and root mean square error RMSE at 3.81 µg/m3. Works on regional PM2.5 concentration maps in Vietnam have been carried out since 2015. A study constructed daily PM2.5 maps at 10×10 km spatial resolution from 2010 to 2014 using a multivariate regression model and on-ground PM2.5 measurements, MODIS and Visible Infrared Imaging Radiometer Suite (VIIRS) AOD, and meteorological data. The study reported results of coefficient of determination R2 at 0.602, root mean square error RMSE at 8.527 µg/m3, and magnitude of relative error MRE at 33.348%. A more recent attempt on Vietnam regional PM2.5 concentration maps presented finer resolution maps (at 3 × 3 km) for a longer period (from 2012 to 2020) using richer input data (integrated satellite AOD, meteorological, and land use maps). The output daily mean PM2.5 maps had high validation results in comparison with ground PM2.5 measurements, with Pearson correlation coefficient r at 0.87, coefficient of determination R2 at 0.75, RMSE at 11.76 µg/m3, and MRE of 36.57% on a total of 13.886 data samples. For the purpose of sharing air quality-related information, aqicn.org is one of the earliest platforms. The website was built by a non-profit project, the World Air Quality Index project, started in 2007 to raise awareness about air pollution among people. As an open platform for sharing air quality data, it allows users around the world to add their air quality stations to the platform and contribute their measurement data. Currently, the project is providing information on air quality in various cities worldwide.
Related documents