USAID
Economic Growth in Zambia
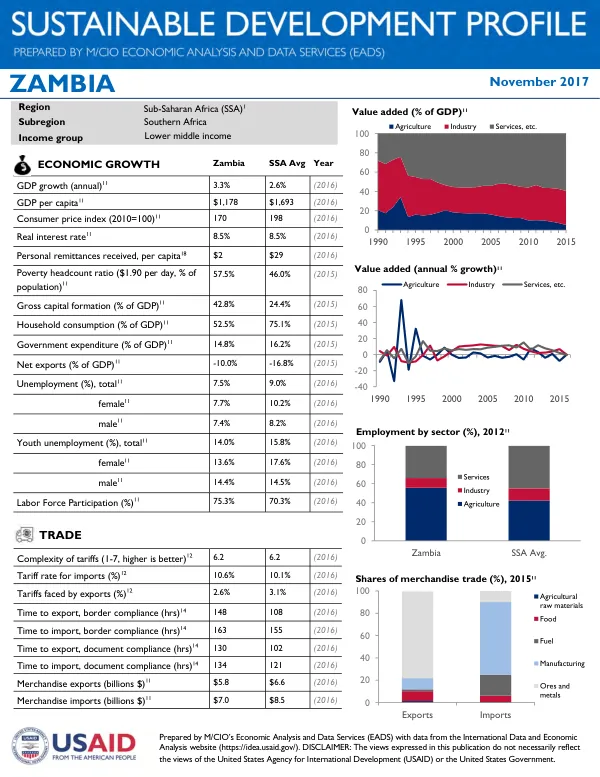
Economic growth in Zambia has been moderate, with GDP growth averaging 3.3% annually from 2010 to 2016.
2017 · 2 pages
Sign in to readA free account is required to download.
Abstract
The country's GDP per capita was $1,178 in 2016, significantly lower than the sub-Saharan Africa average of $1,693. Consumer price index (CPI) inflation was 170 in 2010 and 198 in 2016, indicating a moderate increase in prices over the period. The real interest rate was 8.5% in 2016, consistent with the sub-Saharan Africa average. Poverty headcount ratio in Zambia was 57.5% in 2015, with 46.0% of the population living below the $1.90 per day poverty line. Gross capital formation was 42.8% of GDP in 2015, while household consumption accounted for 52.5% of GDP. Government expenditure was 14.8% of GDP in 2015, and net exports were -10.0% of GDP. Unemployment rates were 7.5% for the total population, 7.7% for females, and 7.4% for males in 2016. Trade complexity in Zambia was 6.2 on a scale of 1-7 in 2016, with a tariff rate for imports of 10.6% and tariffs faced by exports of 2.6%. Time to export and import was 148 and 163 hours, respectively, in 2016. Merchandise exports were $5.8 billion in 2016, while merchandise imports were $7.0 billion. Agriculture is a significant sector in Zambia, with arable land accounting for 15.9% of agricultural area in 2014. Permanent crops accounted for 0.2% of agricultural area, while permanent meadows and pastures accounted for 83.9%. Fertilizer consumption was 46.2 kg/ha in 2014, and cereal yield was 2,755.4 kg/ha. Net production index for agriculture was 176 in 2013, and crop production index was 181 in 2014. The climate risk index score for Zambia was 98.33 in 2015, indicating a high level of climate risk. Deaths by weather events were 0.00 per 100,000 in 2015, and the multi-sectoral platform for disaster risk reduction was functioning at a score of 4 in 2011. EPI biodiversity and habitat score was 97.1 in 2016, and terrestrial and marine protected areas accounted for 37.9% of total area in 2014. Primary energy consumption in Zambia was 0.172 quadrillion BTUs in 2014, with renewable electricity output accounting for 97% of total output. Adjusted savings: energy depletion was 0.0% of GNI in 2015, and firms identifying electricity as a major constraint were 27.1% in 2013. Number of power outages per month was 5.2 in 2013. Zambia's distance to frontier score for enabling the business of agriculture was 3.76 in 2016, indicating a significant gap in agricultural development. Water source by type showed that 85.6% of urban households and 51.3% of rural households had access to improved water sources in 2015. Access to electricity was 25% in rural areas and 75% in urban areas in 2014.
Related documents