FOOD AND AGRICULTURAL ORGANIZATION
PoWPA Afghanistan: Identification of Biodiversity Priority Zones
The PoWPA Afghanistan: Identification of Biodiversity Priority Zones report is accompanied by a series of maps that provide critical information for biodiversity conservation efforts in the country.
13 pages
Sign in to readA free account is required to download.
Abstract
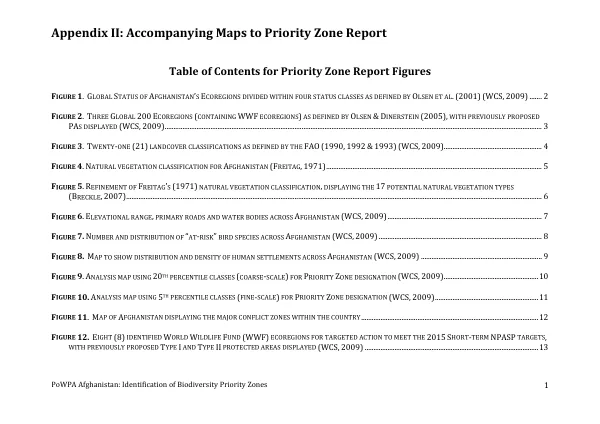
The maps are based on various data sources, including the World Wildlife Fund (WWF) ecoregions, the Food and Agriculture Organization (FAO) landcover classifications, and the Wildlife Conservation Society (WCS) analysis. Figure 1 displays the global status of Afghanistan's WWF ecoregions, divided into four status classes as defined by Olsen et al. (2001). This classification system provides a framework for assessing the conservation status of different ecoregions across the country. Figure 2 presents three global 200 ecoregions, containing WWF ecoregions, as defined by Olsen & Dinerstein (2005). The map displays previously proposed protected areas (PAs) classified as Type I, Type II, or Type III, indicating the expected timeframe for gazetting these areas. Figure 3 shows the 21 landcover classifications as defined by the FAO (1990, 1992 & 1993). This classification system provides a comprehensive framework for understanding the different landcover types across Afghanistan. Figure 4 presents the natural vegetation classification for Afghanistan, as developed by Freitag (1971). This classification system identifies 17 potential natural vegetation types, which are critical for understanding the country's biodiversity. Figure 5 refines Freitag's (1971) natural vegetation classification, displaying the 17 potential natural vegetation types as defined by Breckle (2007). This refined classification system provides a more detailed understanding of the country's natural vegetation. Figure 6 displays the elevational range, primary roads, and water bodies across Afghanistan, based on data from the Shuttle Radar Topography Mission (SRTM) and the WCS (2009). This map provides critical information for understanding the country's topography and infrastructure. Figure 7 shows the number and distribution of "at-risk" bird species across Afghanistan, as identified by the WCS (2009). This map highlights areas of high conservation concern for bird species. Figure 8 presents a map showing the distribution and density of human settlements across Afghanistan, based on data from the Afghanistan Information Management Services (AIMS) and the WCS (2009). This map provides critical information for understanding the human impact on the country's biodiversity. Figure 9 displays an analysis map using 20th percentile classes (coarse-scale) for Priority Zone designation, as developed by the WCS (2009). This map provides a framework for identifying areas of high conservation priority across the country. These maps provide critical information for biodiversity conservation efforts in Afghanistan, highlighting areas of high conservation priority and providing a framework for understanding the country's biodiversity.