USAID DEC
Comparative Analysis of Georgia and Senegal: Peanut Industry and Environmental Concerns
Sign inUSAID
Comparative Analysis of Georgia and Senegal: Peanut Industry and Environmental Concerns
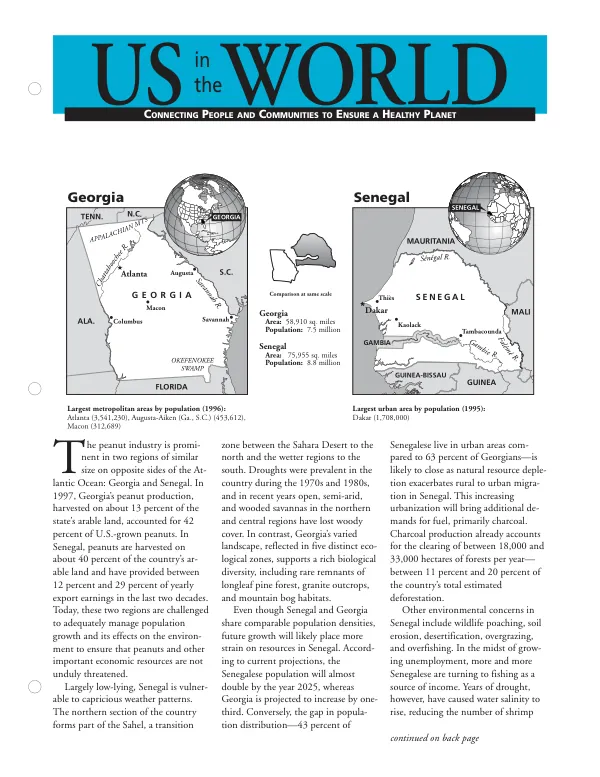
The peanut industry is prominent in two regions of similar size on opposite sides of the Atlantic Ocean: Georgia and Senegal.
4 pages
Sign in to readA free account is required to download.
Abstract
In 1997, Georgia's peanut production, harvested on about 13 percent of the state's arable land, accounted for 42 percent of U.S.-grown peanuts. In Senegal, peanuts are harvested on about 40 percent of the country's arable land and have provided between 12 and 29 percent of the country's export earnings in the last two decades. Senegal is largely low-lying and vulnerable to capricious weather patterns. The northern section of the country forms part of the Sahel, a transition zone between the Sahara Desert to the north and the wetter regions to the south. Droughts were prevalent in the country during the 1970s and 1980s, and in recent years, open, semi-arid, and wooded areas in the northern and central regions have lost their woody cover. In contrast, Georgia's varied landscape, reflected in five distinct ecological zones, supports a rich biological diversity, including rare remnants of longleaf pine forest, outcrops, and bog habitats. Despite sharing similar population densities, future growth is likely to place more strain on resources in Senegal. According to current projections, the Senegalese population will almost double by 2025, whereas Georgia is projected to increase by one-third. The gap in population distribution is also expected to close as natural resource depletion exacerbates migration from rural to urban areas in Senegal. This will bring additional demands for charcoal, which is already a major cause of deforestation, accounting for the clearing of between 18,000 and 33,000 hectares of forests per year. Other environmental concerns in Senegal include wildlife poaching, soil erosion, desertification, overgrazing, and overfishing. In the midst of growing unemployment, more Senegalese are turning to fishing as a source of income, but years of drought have caused water salinity to rise, reducing the number of shrimp. The country's population is also threatened by invasive, non-native plants and animals such as Chinese privet, Japanese honeysuckle, and Asiatic clams. Georgia's population growth has been driven by net migration, with the bulk of new migrants coming from elsewhere in the United States. The area around Atlanta remains the hub of Georgia's growth, with outlying counties having the fastest growth rates. In fact, three counties on the outskirts of Atlanta's metropolitan area grew at least 66 percent between 1992 and 1997, ranking among the 10 fastest-growing counties in the country. Georgia's total gross state product was $184 billion in 1994, the third highest in the country and nearly twice the national increase of 43 percent. However, 13.8 percent of the state's residents lived in poverty from 1995 to 1997, just about the same as the national poverty rate of 13.6 percent. The state's natural resources and wildlife issues include the bald eagle, the peregrine falcon, and the wood stork, which are among the state's endangered and threatened species. Senegal's population growth is driven by a high fertility rate, with an average of six children per woman, down from seven in the past 50 years. This fertility rate is not enough to compensate for extended life expectancy, which has increased from 36 years at mid-century to nearly 50 years at the close of the century. The country's age structure will continue to grow as youth enter their childbearing years. One in five children in Senegal is moderately or severely underweight, and child deaths have declined by 64 percent since 1960 but remain 11 times higher than the U.S. rate. Senegal's natural resources and wildlife issues include the red-fronted gazelle, lion, African elephant, chimpanzee, marbled teal, and other species. The country has lost its large, ecologically intact, and relatively undisturbed forests, and water availability per capita is half that of the United States. Fifty percent of Senegal's energy comes from traditional fuels such as fuelwood, fuelwood, and animal waste, and per capita use of commercial forms of energy is 1.6 percent of that in the United States.