USAID DEC
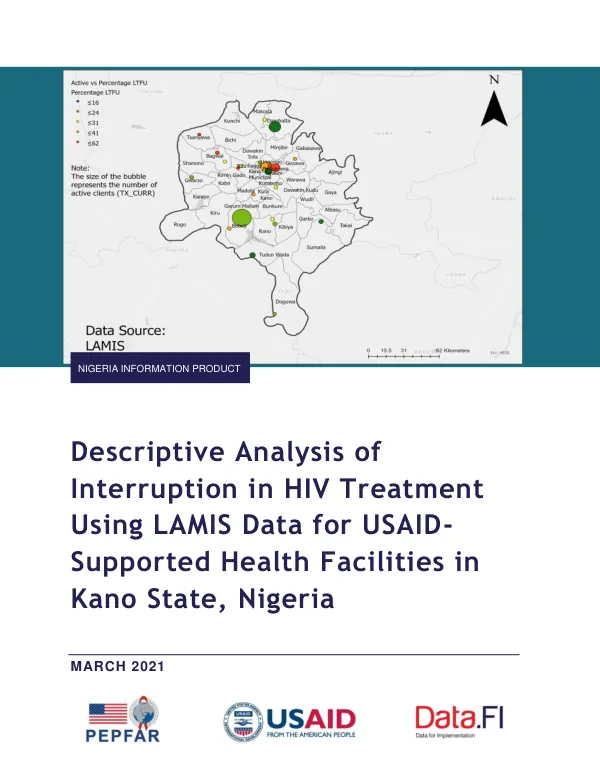
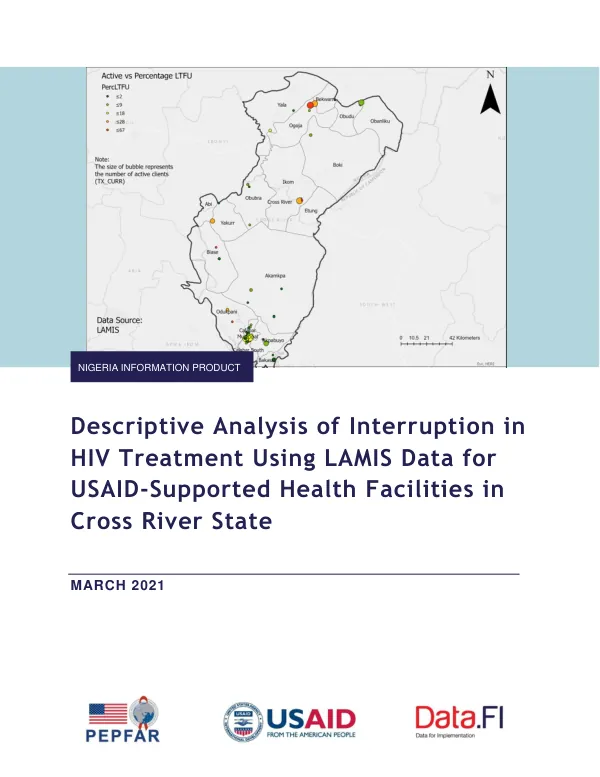
Descriptive Analysis of Interruption in HIV Treatment Using LAMIS Data for USAID-Supported Health Facilities in Cross River State
Sign inPALLADIUM INTERNATIONAL, LLC
Descriptive Analysis of Interruption in HIV Treatment Using LAMIS Data for USAID-Supported Health Facilities in Cross River State
The President's Emergency Plan for AIDS Relief (PEPFAR) has made significant progress in Nigeria over the last 15 years, in partnership with the Nigerian government, civil society, and implementing partners.
2021 · 24 pages
Sign in to readA free account is required to download.
Abstract
Critical to sustaining these accomplishments are developing and implementing client-centered care models to support people living with HIV (PLHIV) in continuing to engage in treatment and achieving viral suppression. Understanding facility and client data trends related to engagement in treatment is essential to tracking progress toward universal continuity of care and improving programs' ability to retain PLHIV on treatment. A study on antiretroviral treatment in lower-income countries (ART-LINC) found that loss/lost to follow-up (LTFU)—that is, interruption in treatment—after one year was above 40% in some programs. In Nigeria, one study found that rates of interruption in treatment were 28%, while another study found interruption in treatment rates of 31%. Understanding which PLHIV are likely to experience interruption in treatment is essential to assessing program impact and tailoring HIV programming to bring those clients back into treatment with care models that are accessible and meet their needs. Some factors that potentially influence interruption in treatment are low HIV risk perception, geographic terrain, religious and superstitious beliefs, and stigma. The National Data Repository (NDR) provides an opportunity to conduct analysis of interruption in treatment across the HIV cohort in Nigeria. The NDR is a database platform designed to hold all national client-level HIV care and treatment data. U.S. Agency for International Development implementing partners (IPs) upload data to the NDR via the Lafiya Management Information System (LAMIS). The data parameters uploaded into the NDR include but are not limited to ART/hospital number, facility name, state, ART start date, date of birth, last clinic date, regimen given, and number of days of antiretrovirals (ARVs). Each record in the NDR is updated with the most recent information from the client clinic visit. The objectives of this analysis are to perform a descriptive analysis of the LAMIS data within the NDR to highlight any potential relationships that may exist between a client's current 28-day status (active or LTFU) and other client variables. The analysis also aims to describe the relationship of a subset of variables with interruption in treatment at USAID-supported PEPFAR sites, including age, sex, and time on ART. Additionally, the analysis seeks to identify and profile sites within Cross River State with disproportionately low continuity of treatment. The data source for this analysis is retrospective cohort data from 484 USAID-supported PEPFAR facilities across 16 states that initiated ART. The data cleaning process involved compiling 616,762 LAMIS client records from all USAID-supported states, partners, and facilities into a single database for analysis. Figure 1 shows the distribution of client records by current ART status (stopped; transferred out; active; dead; and interruption in treatment). The analysis was conducted using the R software to explore relationships associated with clients experiencing interruption in treatment in four USAID priority states. The results of the analysis will provide insights into the factors associated with interruption in treatment and identify sites within Cross River State with disproportionately low continuity of treatment. This information will be essential to assessing program impact and tailoring HIV programming to bring those clients back into treatment with care models that are accessible and meet their needs. The analysis will also inform strategies to improve programs' ability to retain PLHIV on treatment and achieve universal continuity of care. The analysis found that the distribution of client records by current ART status was as follows: stopped (14.1%), transferred out (6.3%), active (63.4%), dead (1.4%), and interruption in treatment (14.8%). The analysis also found that the majority of clients (63.4%) were currently active on treatment, while 14.8% were experiencing interruption in treatment. The results of the analysis will be presented in the following sections. The analysis found that the distribution of client records by current ART status varied by state, with some states having higher rates of interruption in treatment than others. For example, the state with the highest rate of interruption in treatment was Cross River State, with 17.1% of clients experiencing interruption in treatment. The state with the lowest rate of interruption in treatment was Lagos State, with 10.3% of clients experiencing interruption in treatment. The analysis also found that the distribution of client records by current ART status varied by facility type, with some facility types having higher rates of interruption in treatment than others. For example, the facility type with the highest rate of interruption in treatment was the general hospital, with 16.5% of clients experiencing interruption in treatment. The facility type with the lowest rate of interruption in treatment was the health center, with 11.1% of clients experiencing interruption in treatment. The analysis found that the distribution of client records by current ART status varied by age group, with some age groups having higher rates of interruption in treatment than others.
Related documents