ABT ASSOCIATES
ECG Interpretation
The primary health care initiatives project focuses on ECG interpretation, a critical skill for healthcare professionals.
2 pages
Sign in to readA free account is required to download.

Abstract
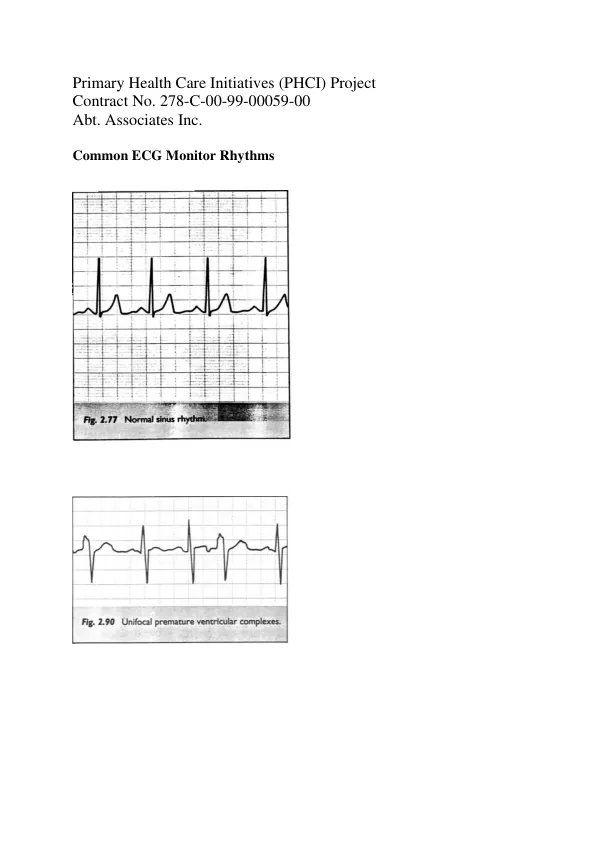
Understanding the basic electrical physiology of the heart is essential for accurate ECG interpretation. The heart's electrical activity is generated by the sinoatrial node, which sends electrical impulses to the atria and ventricles. These impulses are recorded by ECG electrodes placed on the body. ECG leads are used to read the cardiac electrical activity, with each lead providing a unique perspective on the heart's electrical activity. The placement of ECG leads is critical, as it affects the accuracy of the ECG interpretation. The standard 12-lead ECG provides a comprehensive view of the heart's electrical activity, with each lead offering information on the heart's rate, rhythm, and axis. A normal QRS complex is a critical component of ECG interpretation. The QRS complex represents the depolarization of the ventricles, and its shape and duration can indicate various cardiac conditions. The cardiac rate is determined by counting the number of QRS complexes in a given time period, typically 60 seconds. Tachycardia, or a rapid heart rate, is defined as a rate greater than 100 beats per minute, while bradycardia, or a slow heart rate, is defined as a rate less than 60 beats per minute. Irregular heart rhythms, including atrial and ventricular arrhythmias, can be identified on an ECG. Atrial fibrillation is a common arrhythmia characterized by an irregularly irregular rhythm, while ventricular tachycardia is a life-threatening arrhythmia that requires immediate medical attention. The axis quadrant of the ECG is determined by the direction of the electrical flow through the heart, with a left axis deviation indicating left ventricular hypertrophy and a right axis deviation indicating right ventricular hypertrophy. Atrial and ventricular hypertrophy can be identified on an ECG by analyzing the P wave and QRS complex. Atrial hypertrophy is characterized by a tall P wave in lead II, while ventricular hypertrophy is characterized by a sum of the height of the S wave in V1 or V2 and the R wave in V5 or V6 greater than 35 mm. Ischemia and infarction can be identified on an ECG by analyzing the ST segment and Q wave. ST segment elevation, particularly in leads II, III, and avF, and V1-6, is a critical indicator of myocardial infarction. The critical elements for referral include all ECG interpretations that should be verified by a cardiologist, patients with significant abnormalities on ECG, and patients with chest pain or suspected myocardial infarction. The critical elements for evaluation of competence include correct placement of ECG leads, correct and structured interpretation of rate, rhythm, axis, hypertrophy, and infarction, and identification of abnormalities in these elements.