USAID DEC
Spatial & temporal patterns of the swine trade in Argentina from 2011 to 2016 using graph theory and network analysis
Sign inUNIVERSITY OF CALIFORNIA AT DAVIS
Spatial & temporal patterns of the swine trade in Argentina from 2011 to 2016 using graph theory and network analysis
Spatial and temporal patterns of the swine trade in Argentina from 2011 to 2016 were evaluated using graph theory and network analysis.
2016 · 1 pages
Sign in to readA free account is required to download.
Abstract
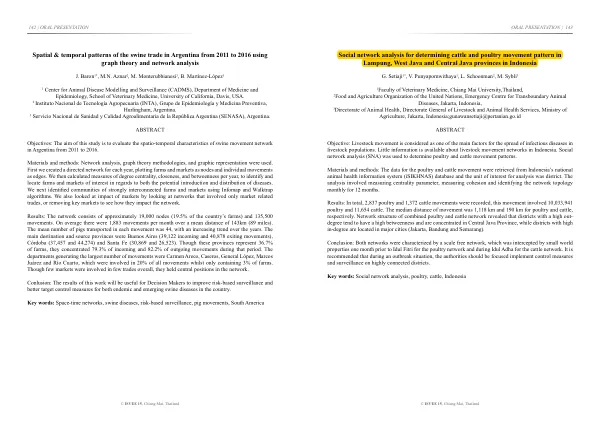
The study aimed to identify and locate farms and markets of interest in regards to the potential introduction and distribution of diseases. A directed network was created for each year, plotting farms and markets as nodes and individual movements as edges. Measures of degree centrality, closeness, and betweenness were calculated per year to identify key farms and markets. The network consisted of approximately 19,000 nodes, representing 19.5% of the country's farms, and 135,500 movements. On average, there were 1,883 movements per month over a mean distance of 143km. The main destination and source provinces were Buenos Aires, Córdoba, and Santa Fe, which concentrated 79.3% of incoming and 82.2% of outgoing movements during that period. The departments generating the largest number of movements were Carmen Areco, Caseros, General López, Marcos Juárez, and Río Cuarto, which were involved in 20% of all movements while only containing 3% of farms. Few markets were involved in few trades overall, but they held central positions in the network. The results of this study will be useful for decision makers to improve risk-based surveillance and better target control measures for both endemic and emerging swine diseases in the country. The study's findings highlight the importance of understanding the spatial and temporal patterns of the swine trade in Argentina to inform disease control strategies. In a separate study, social network analysis was used to determine cattle and poultry movement patterns in Lampung, West Java, and Central Java provinces in Indonesia. The data for the poultry and cattle movement were retrieved from Indonesia's national animal health information system (iSIKHNAS) database. The analysis involved measuring centrality parameters, measuring cohesion, and identifying the network topology monthly for 12 months. The results showed that the network structure of combined poultry and cattle networks revealed that districts with a high out-degree tend to have a high betweenness and are concentrated in Central Java Province, while districts with high in-degree are located in major cities. Both networks were characterized by a scale-free network, which was intercepted by small-world properties one month prior to Idul Fitri for the poultry network and during Idul Adha for the cattle network. It is recommended that during an outbreak situation, the authorities should focus on implementing control measures and surveillance on highly connected districts.