KIMETRICA LLC
Staples Value Chain Activity – Baseline Report: Annex3
The Staples Value Chain Activity baseline report outlines the sampling procedures for a baseline survey in Tanzania.
2 pages
Sign in to readA free account is required to download.
Abstract
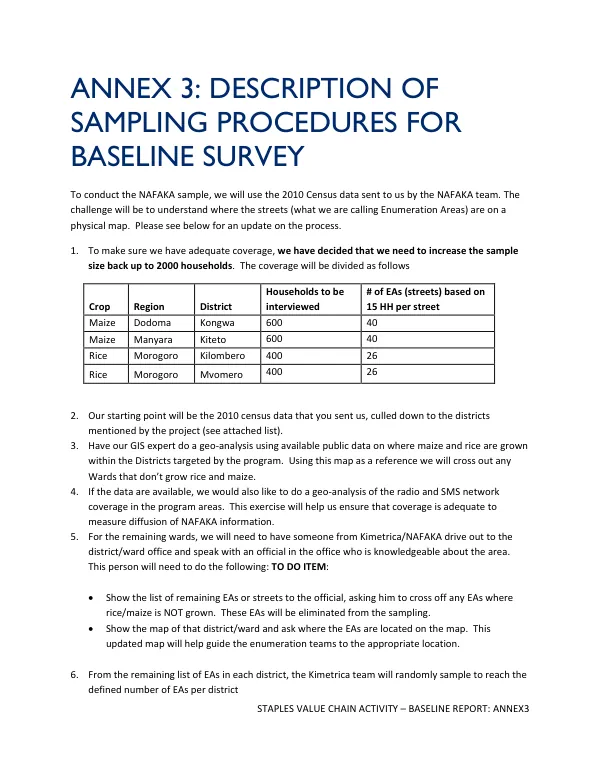
The survey aims to collect data on the maize and rice value chains in several districts. To ensure adequate coverage, the sample size has been increased to 2000 households, divided among four crop regions: maize in Dodoma and Manyara districts, and rice in Morogoro districts. The sampling process begins with the 2010 census data provided by the NAFAKA team. The data is then filtered to include only the districts targeted by the project. A geographic information system (GIS) expert conducts a geo-analysis using public data on maize and rice cultivation within the targeted districts. This analysis helps to identify wards that do not grow rice and maize, which are then eliminated from the sampling frame. To further refine the sampling frame, the team conducts a geo-analysis of radio and SMS network coverage in the program areas. This exercise ensures that the sampling frame is adequate to measure the diffusion of NAFAKA information. For the remaining wards, a team member from Kimetrica/NAFAKA visits the district/ward office to obtain information on the location of enumeration areas (EAs) from an official knowledgeable about the area. The team then randomly samples EAs from the remaining list to reach the defined number of EAs per district. Enumerators travel to the selected EAs and use a random sampling method to select households. Each enumerator drops a stick within the EA and walks in the direction it falls, passing two households and interviewing the third household. This process is repeated after completion of the interview. To address challenges related to the use of 2010 data, the team plans to perform rigorous back-checking of the data, particularly the GIS coordinates. The 15 households from a given EA should be clustered in that area. Additionally, the team proposes to conduct focus group discussions (FGDs) and key informant (KI) interviews with farmers, producer groups, local traders, input suppliers, and product purchasers to assess market conditions. The proposed FGDs and KI interviews are as follows: 24 FGDs with farmers, 10 with producer groups, 10 with local traders, and additional interviews with input suppliers and product purchasers. The numbers for the latter may be determined by the value chain analysis. The breakout by district is indicative and may change according to population information.