FEWS NET
Production and Market Flow Maps: Angola Cassava
The Democratic Republic of the Congo, Congo, Zambia, Zimbabwe, Namibia, and Botswana are among the countries included in the production and trade flow maps for Angola cassava.
2013 · 1 pages
Sign in to readA free account is required to download.
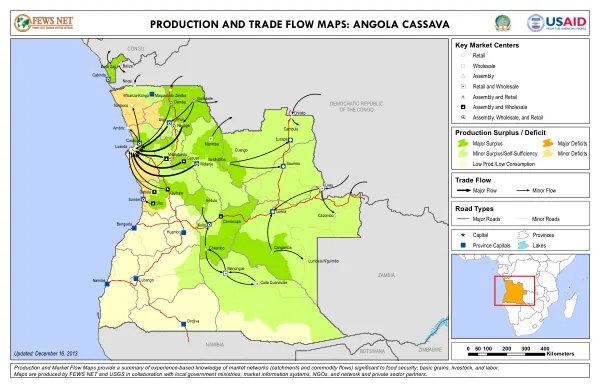
Abstract
The maps provide a summary of experience-based knowledge of market networks, including catchments and commodity flows, significant to food security. Key market centers, provinces, and province capitals are identified, along with major and minor roads, lakes, and retail, wholesale, and assembly markets. Production and market flow maps are produced by FEWS NET and USGS in collaboration with local government ministries, market information systems, NGOs, and network and private sector partners. The maps categorize production and trade flows into major surplus, minor surplus/self-sufficiency, low production/low consumption, major deficits, and minor deficits. This categorization is based on data from various sources, including local government ministries and market information systems. The maps also identify key market centers, including retail, wholesale, and assembly markets. These markets are critical to the trade flow of cassava and other commodities in the region. Major and minor trade flows are also identified, with major flows indicating significant movement of commodities between regions. The maps provide a comprehensive overview of the production and trade flow of cassava in Angola and surrounding countries. The production and market flow maps are an essential tool for understanding the complex market networks and commodity flows in the region. They provide valuable information for policymakers, researchers, and practitioners working to improve food security and agricultural development in the region. The maps can be used to identify areas of surplus or deficit, inform trade policies, and support the development of more effective market information systems. The maps are updated regularly to reflect changes in production and trade flows. The most recent update was made on December 16, 2013. The maps are presented in a clear and concise format, with production and trade flows represented on a scale of 0 to 400 kilometers. This format allows users to easily identify areas of high production and trade activity and to track changes over time.
Related documents