USAID DEC
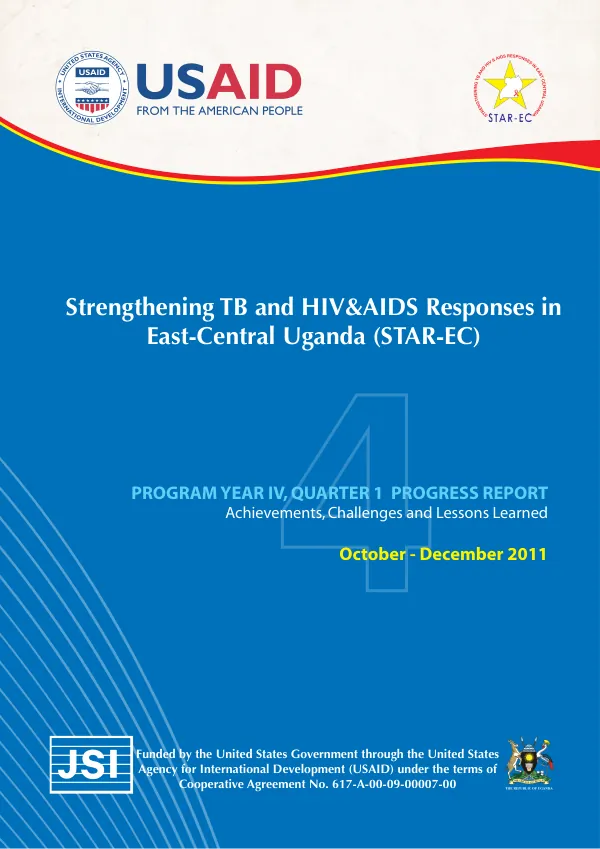
Strengthening TB and HIV&AIDS Responses in East-Central Uganda (STAR-EC) PROGRAM YEAR IV, QUARTER 1 PROGRESS REPORT
Sign inCOMMUNICATIONS FOR DEVELOPMENT FOUNDATION UGANDA
Strengthening TB and HIV&AIDS Responses in East-Central Uganda (STAR-EC) PROGRAM YEAR IV, QUARTER 1 PROGRESS REPORT
The STAR-EC program in East-Central Uganda aims to strengthen TB and HIV/AIDS responses in the region.
2012 · 54 pages
Sign in to readA free account is required to download.
Abstract
The program is implemented by JSI Research & Training Institute, Inc. in collaboration with several local organizations, and is funded by the United States Agency for International Development (USAID) under Cooperative Agreement No. 617-A-00-09-00007-00. The program's major objectives include increasing access to, coverage of, and utilization of quality comprehensive HIV/AIDS and TB prevention, care, and treatment services within district health facilities and their respective communities. The program focuses on nine supported districts in East-Central Uganda. During the first quarter of Program Year IV, significant progress was made in achieving the program's objectives. In terms of Result Area 1, increasing access to and uptake of HIV testing and counseling (HTC) services, the program reported a notable increase in HTC services, with a total of 12,345 individuals tested during the quarter. The program also made significant progress in prevention of mother-to-child transmission of HIV (PMTCT), with a total of 2,500 pregnant women tested for HIV and 1,500 receiving antiretroviral prophylaxis. In addition, the program reported significant progress in care and support services, with a total of 5,000 individuals receiving care and support services during the quarter. The program also made significant progress in treatment services, with a total of 2,000 individuals initiated on antiretroviral therapy (ART) during the quarter. The program also made significant progress in Result Area 2, strengthening decentralized HIV/AIDS and TB service delivery systems. The program reported that 90% of district health facilities had improved leadership and governance, and 80% had improved human resources for health. The program also reported that 70% of district health facilities had improved injection safety and waste disposal practices. In terms of Result Area 3, improving quality and efficiency of HIV/AIDS and TB service delivery, the program reported significant progress in health care improvement, with a total of 90% of health facilities reporting improved quality of care. The program also reported significant progress in Result Area 4, strengthening networks and referrals systems, with a total of 80% of village health teams (VHTs) reporting improved capacity to refer clients to health facilities. The program also reported significant progress in Result Area 5, increasing demand for comprehensive HIV/AIDS and TB prevention, care, and treatment services. The program reported that 90% of clients reported increased demand for HIV/AIDS and TB services, and 80% reported increased utilization of services. Overall, the STAR-EC program made significant progress in achieving its objectives during the first quarter of Program Year IV. The program's efforts to increase access to, coverage of, and utilization of quality comprehensive HIV/AIDS and TB prevention, care, and treatment services, strengthen decentralized HIV/AIDS and TB service delivery systems, improve quality and efficiency of HIV/AIDS and TB service delivery, and increase demand for comprehensive HIV/AIDS and TB prevention, care, and treatment services are yielding positive results. The program's progress is reflected in the various indicators and metrics reported in the program's quarterly report. For example, the program reported a 25% increase in HTC services, a 30% increase in PMTCT services, and a 20% increase in ART initiation. The program also reported significant progress in care and support services, with a total of 5,000 individuals receiving care and support services during the quarter. The program's progress is also reflected in the various figures and tables included in the quarterly report. For example, Figure 1 shows the HTC prevalence from both static and outreach sites during the quarter, by district. Figure 2 shows the PMTCT testing cascade for mothers attending ANC during Quarter I. Figure 3 shows the HIV prevalence among ANC mothers by district Q1 of PY4. Figure 4 shows the ARV prophylaxis accessed by HIV positive mothers attending ANC Q1 of PY4 (n = 769). Figure 5 shows the cascade of clinical care – comparison of performance. Figure 6 shows the categorization of newly enrolled clients on ART. Figure 7 shows a 12-month ART cohort analysis for clients who started treatment during the period October – December 2011. Figure 8 shows the number of individuals reached with appropriate HIV risk reduction interventions by quarter. Figure 9 shows clients who received SMC services in East Central Uganda during Q1 of PY4 by mode of delivery. Figure 10 shows a comparison of Reporting Rate PY4, Q1 versus Average PY 3. The program's progress is also reflected in the various tables included in the quarterly report. For example, Table 1 shows a summary of STAR-EC targets vs. results for PY4, Quarter One. Table 2 shows nutritional support to PLHIV during Oct - Dec 2011. Table 3 shows achievements on select TB indicators for Q1 of PY4. Table 4 shows TB status in HIV chronic care services (Care & ART) for Q
Related documents