USAID DEC
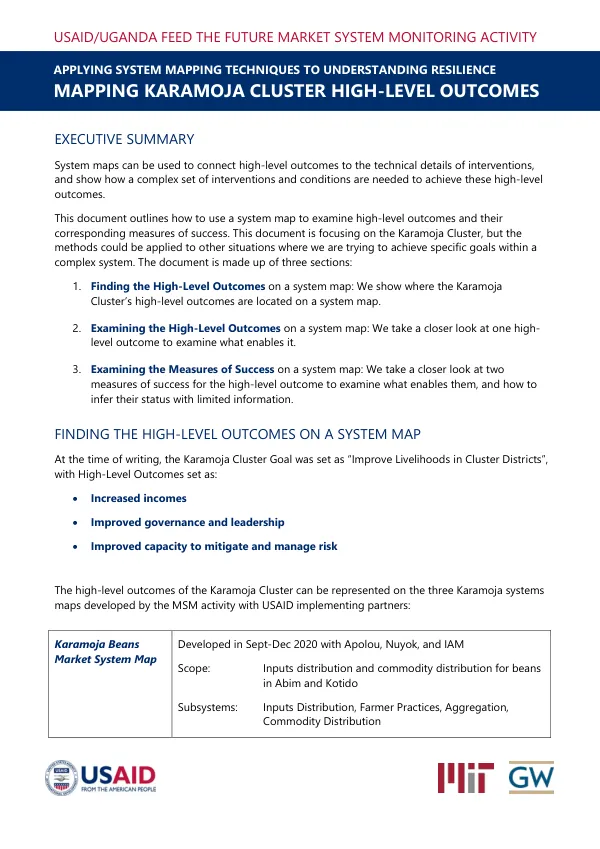
USAID/UGANDA FEED THE FUTURE MARKET SYSTEM MONITORING ACTIVITY MAPPING KARAMOJA CLUSTER HIGH-LEVEL OUTCOMES
Sign inUSAID
USAID/UGANDA FEED THE FUTURE MARKET SYSTEM MONITORING ACTIVITY MAPPING KARAMOJA CLUSTER HIGH-LEVEL OUTCOMES
The Karamoja Cluster Goal is to "Improve Livelihoods in Cluster Districts" with three high-level outcomes: Increased incomes, Improved governance and leadership, and Improved capacity to mitigate and manage risk.
2021 · 13 pages
Sign in to readA free account is required to download.
Abstract
These outcomes are represented on three system maps developed by the USAID/UGANDA Feed the Future Market System Monitoring Activity: the Karamoja Beans Market System Map, the Karamoja Livestock System Map, and the Karamoja Household Resilience Map. The Karamoja Household Resilience Map is a comprehensive system map that captures the high-level outcomes, including Increased incomes, Improved governance and leadership, and Improved capacity to mitigate and manage risk. The map shows that Increased incomes is enabled by three key income-generating activities: farming, pastoralism, and non-agricultural activities. These activities are in turn enabled by various elements, including household savings, remittances, and access to credit. The Karamoja Beans Market System Map provides a more detailed view of the income-generating activities, specifically focusing on the beans value chain in Abim and Kotido. The map shows that Increased incomes is represented as the Key Outcome "Farmer has sufficient income," which is enabled by sales through different channels, access to savings and loans groups, and receipt of a fair price for beans. The system maps can be used to examine the high-level outcomes and their corresponding measures of success. By analyzing the enabling elements and connections between them, it is possible to identify areas where interventions may be needed to achieve the high-level outcomes. For example, the system maps can be used to examine why certain outcomes may not be met, such as limited income generation due to inadequate access to credit or willingness to invest in improved productivity. The Karamoja Cluster high-level outcomes can be represented on multiple system maps, allowing for a more comprehensive understanding of the complex relationships between the outcomes and their enabling elements. By examining the system maps, it is possible to identify areas where interventions may be needed to achieve the high-level outcomes and improve livelihoods in the Karamoja Cluster. The system maps can also be used to examine the measures of success for the high-level outcomes. For example, the Karamoja Household Resilience Map shows that the measure of success for Increased incomes is "Household earns income regularly." This measure is enabled by various elements, including household savings, remittances, and access to credit. By analyzing the enabling elements and connections between them, it is possible to identify areas where interventions may be needed to achieve the measure of success. The system maps can be viewed dynamically in Kumu, a free online tool used to create and view these maps. The maps can be zoomed and panned around to examine the enabling elements and connections between them in more detail. This allows for a more comprehensive understanding of the complex relationships between the outcomes and their enabling elements. Overall, the system maps provide a valuable tool for examining the high-level outcomes and their corresponding measures of success in the Karamoja Cluster. By analyzing the enabling elements and connections between them, it is possible to identify areas where interventions may be needed to achieve the high-level outcomes and improve livelihoods in the Karamoja Cluster.