USAID DEC
Enhancing Capacity for Low Emission Development Strategies (EC-LEDS) Clean Energy Program: Overview of Building Stock of Georgia Based on Different Criteria
Sign inUSAID
Enhancing Capacity for Low Emission Development Strategies (EC-LEDS) Clean Energy Program: Overview of Building Stock of Georgia Based on Different Criteria
The existing building stock of Georgia is diverse in terms of construction types and functions.
2016 · 37 pages
Sign in to readA free account is required to download.
Abstract
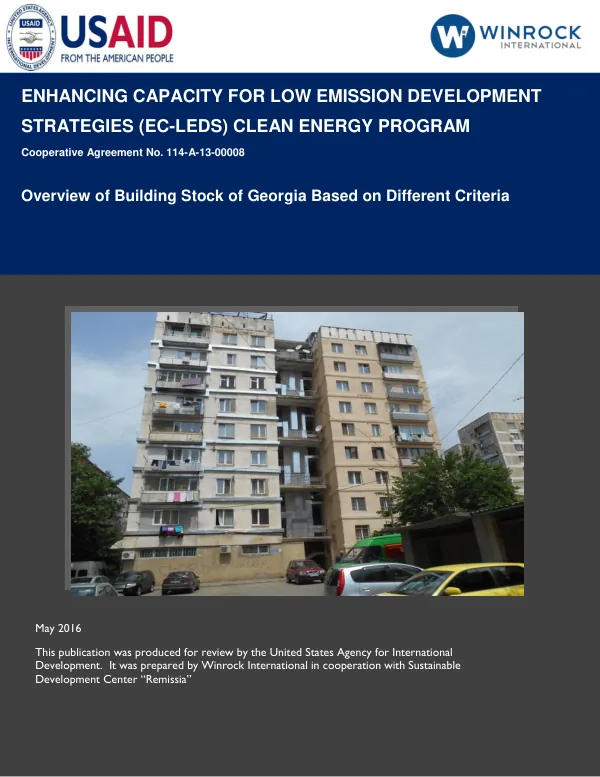
The stock is comprised of buildings constructed before, during, and after the 20th century Soviet era. Approximately 53% of the population resides in urban areas, while 47% lives in rural spaces, resulting in a large diversity of residential buildings. A comprehensive overview of the building stock is not currently available, although some information and data collection have been conducted on a city level during the preparation of Sustainable Energy Action Plans (SEAPs). According to this information and other sources, the total amount and area of buildings have been estimated during the preparation of the low-emission strategy. Approximately 65% of the existing buildings were constructed between the 1950s and the 2000s, with most being multi-storey building blocks. The most popular type of building in the beginning of the 1960s was the so-called "Khrushchovkas." These buildings were designed with engineering and construction criteria that reflected the politics of the government at that time, which aimed to satisfy minimal living conditions. The lifetime of these buildings was 25 years, and most were built 50 years ago. The most widely-distributed construction project was N 1-319C, N 1-450C, and N 1-464AC. Each type within this project was planned with different construction materials and durability against earthquakes of magnitude 7. Initially, these buildings were constructed with bricks, which were later replaced by large constructing blocks and panels. The construction of 8-storey buildings under this project began later. The thermal resistance of buildings from that time was low due to minimal comfort and sanitary-hygienic criteria. The thermal resistance coefficient of those buildings satisfied obligatory standards, which according to the construction code was not more than R=0.575 m2°/W. Private houses accommodating one or two families were also built during the Soviet era and mostly correspond to the construction practice of that period. These houses were typically built with bricks or cement blocks. The coefficient of thermal resistance of walls was usually on the level of obligatory coefficient (R=0.575 m2°/W), indicating the necessity of supplying a superfluous amount of heat to the buildings. The building stock was grouped and estimated by different criteria for implementing energy-efficient measures and increasing consumption of renewable energy, including property type (7 types), location by climate zone (3 zones), location by technological zone (5 zones), functional purpose of building, building types by construction, and rate of use and whole consumption of energy by building. The building stock in Georgia can be grouped into different categories based on various criteria. The property type includes 7 categories, such as private houses, multi-storey buildings, and public buildings. The location by climate zone includes 3 zones, which are the mountainous, temperate, and subtropical zones. The location by technological zone includes 5 zones, which are the First, Second, Third, Fourth, and Fifth Technological Zones. The functional purpose of building includes residential, commercial, and industrial buildings. The building types by construction include multi-storey buildings, private houses, and public buildings. The rate of use and whole consumption of energy by building includes the energy consumption patterns of different types of buildings. The energy consumption patterns of buildings in Georgia vary depending on the type of building, location, and functional purpose. The energy consumption trend in residential buildings shows a steady increase over the years, while the energy consumption trend in commercial buildings shows a fluctuating pattern. The fuel consumption trend in residential buildings is dominated by natural gas, while the fuel consumption trend in commercial buildings is dominated by electricity. The energy consumption by residential and commercial buildings in 2013-2014 shows a significant difference between the two types of buildings. The distribution of CO2 emissions in percentages by fuel and building types shows that the majority of CO2 emissions come from residential buildings. The total energy consumption by zones (%) and the distribution of CO2 emissions by zones (%) show that the energy consumption and CO2 emissions vary significantly across different zones.
Related documents
Documents in this collection
 2015
2015USAID DEC
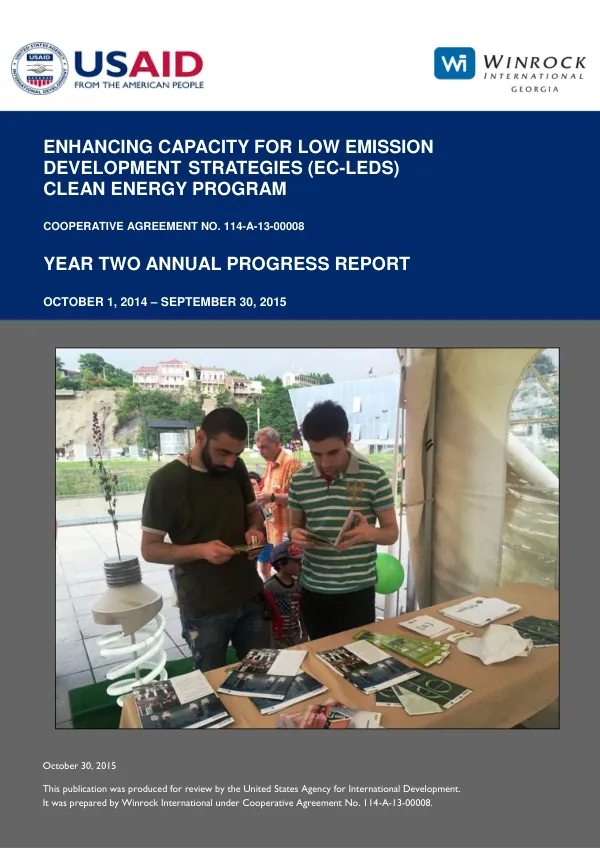
Enhancing Capacity for Low Emission Development Strategies (EC-LEDS) Clean Energy Program Year Two Annual Report (Oct 2014 – September 2015)
Open record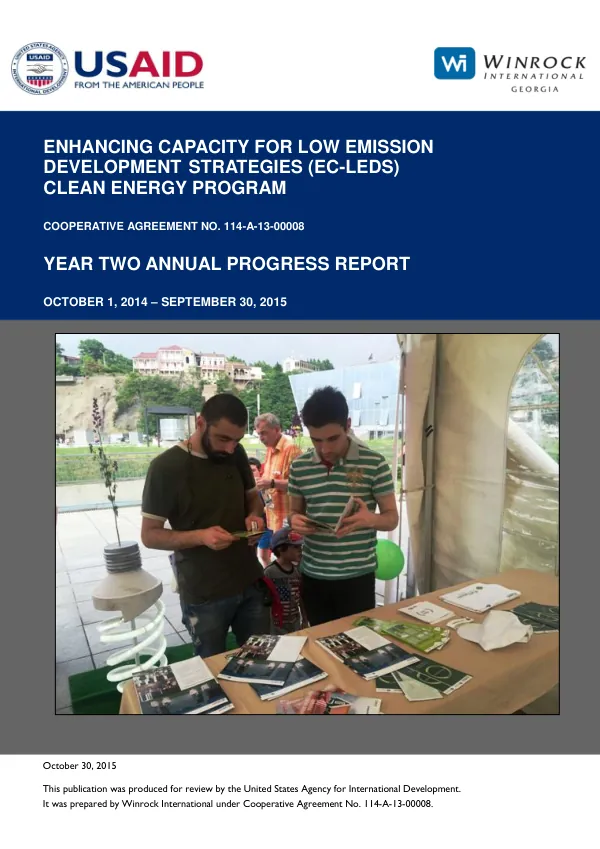 2015
2015USAID DEC