ADRA
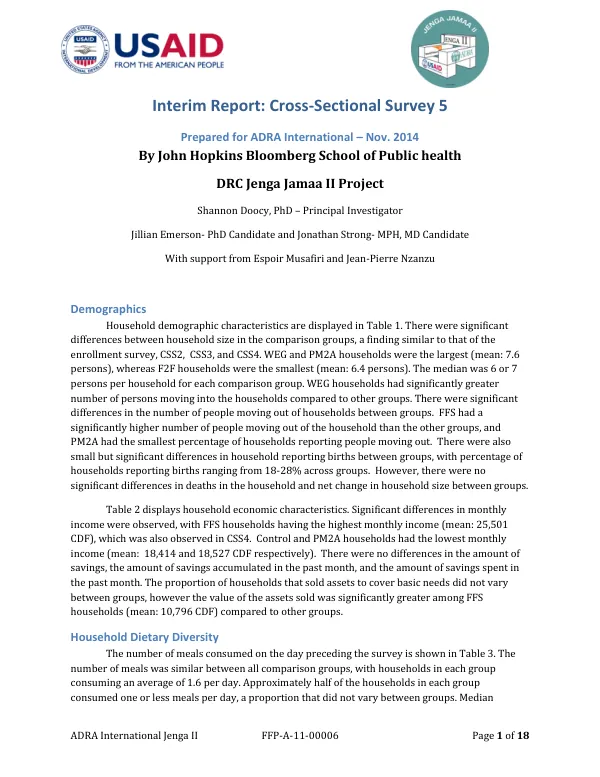
Interim Report: Cross-Sectional Survey 5
The DRC Jenga Jamaa II Project, implemented by ADRA International, aimed to assess the impact of various interventions on household food security and nutritional status.
2014 · 18 pages
Sign in to readA free account is required to download.
Abstract
The project was conducted in the Democratic Republic of Congo, with a focus on five comparison groups: WEG, PM2A, FFS, F2F, and Control. Household demographic characteristics revealed significant differences between comparison groups, with WEG and PM2A households being the largest, and F2F households being the smallest. WEG households had a significantly greater number of persons moving into the households compared to other groups. The median household size was 6 or 7 persons per household for each comparison group. Household economic characteristics showed significant differences in monthly income, with FFS households having the highest monthly income (mean: 25,501 CDF), and Control and PM2A households having the lowest monthly income (mean: 18,414 and 18,527 CDF respectively). The proportion of households that sold assets to cover basic needs did not vary between groups, but the value of the assets sold was significantly greater among FFS households. Household dietary diversity was similar between comparison groups, with approximately half of the households in each group consuming one or less meals per day. Median household dietary diversity score (HDDS) was 4 for WEG, PM2A, and FFS households, but there were no significant differences in the HDDS between groups. Fruit consumption was significantly lower in Control and FFS households compared to WEG, PM2A, and F2F households. Months of adequate food provisioning showed that between 89.5% and 94.5% of households reported not having enough food to eat in one or more months in the preceding year. The mean number of months did not vary significantly between groups, with the mean number of months ranging from 2.8 to 3.3. Household food insecurity was nearly universal among households in each comparison group, with approximately 85% or more of households experiencing worrying about insufficient food, not being able to eat preferred foods due to lack of resources, and eating undesirable foods due to lack of resources. Aggregate measures of household food insecurity showed that risk in each domain of food insecurity was nearly ubiquitous, with approximately 95% of households in each group at risk in the insufficient quality domain and the insufficient intake domain. Children's dietary diversity and food frequency showed that the mean and median minimum dietary diversity score was similar between groups, with the control group having a slightly higher median score of 3.0 and the rest of the groups having a median score of 2.0. The number of meals or snacks per day did not vary between groups, and ranged from 1.7 to 1.9. Children's nutritional status showed that the prevalence of acute malnutrition, as assessed by weight-for-height z-score, did not vary between comparison groups. However, the prevalence of chronic malnutrition, as assessed by height-for-age z-scores, was significantly higher among F2F households (mean: 73.5%) compared to other groups. Underweight, measured by weight-for-age z-score, was most prevalent in Control children (25.7%) and F2F children (23.9%). Water, sanitation, and hygiene (WASH) indicators showed that approximately 44% of households obtained water from a public tap, 12% from a source that is piped into their yard/plot, and 22% from a river or stream. There were significant differences across groups for the proportion of households utilizing an improved source, with the Control group having the largest proportion of households (75%) reporting utilization of an improved source, and F2F and FFS having the lowest proportion of households (65%).
Related documents